Tag Trends
The Tag Trends dashboard includes a number of visualizations to help understand the tags represented by the current search results.
View Options
Share the Screen
Any particular view can be bookmarked or shared with a teammate. Just copy the URL and send it.
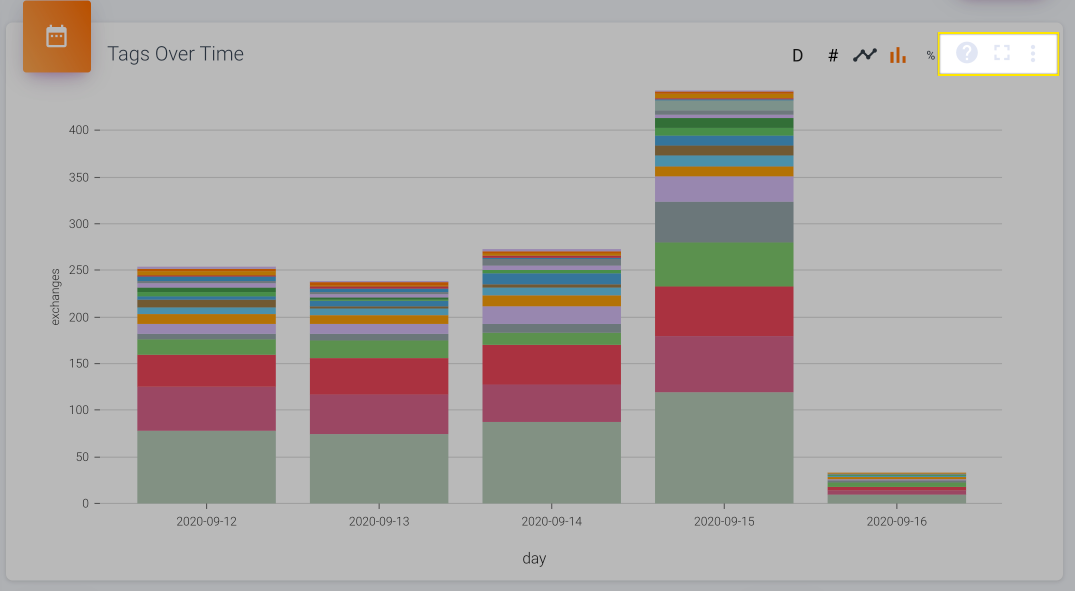
Every view on a dashboard includes at least three options in its top-right corner:
- Tooltip explaining what the view is
- Maximize the view
- Export the view's data (including data not shown) to a CSV
Interactive Legend
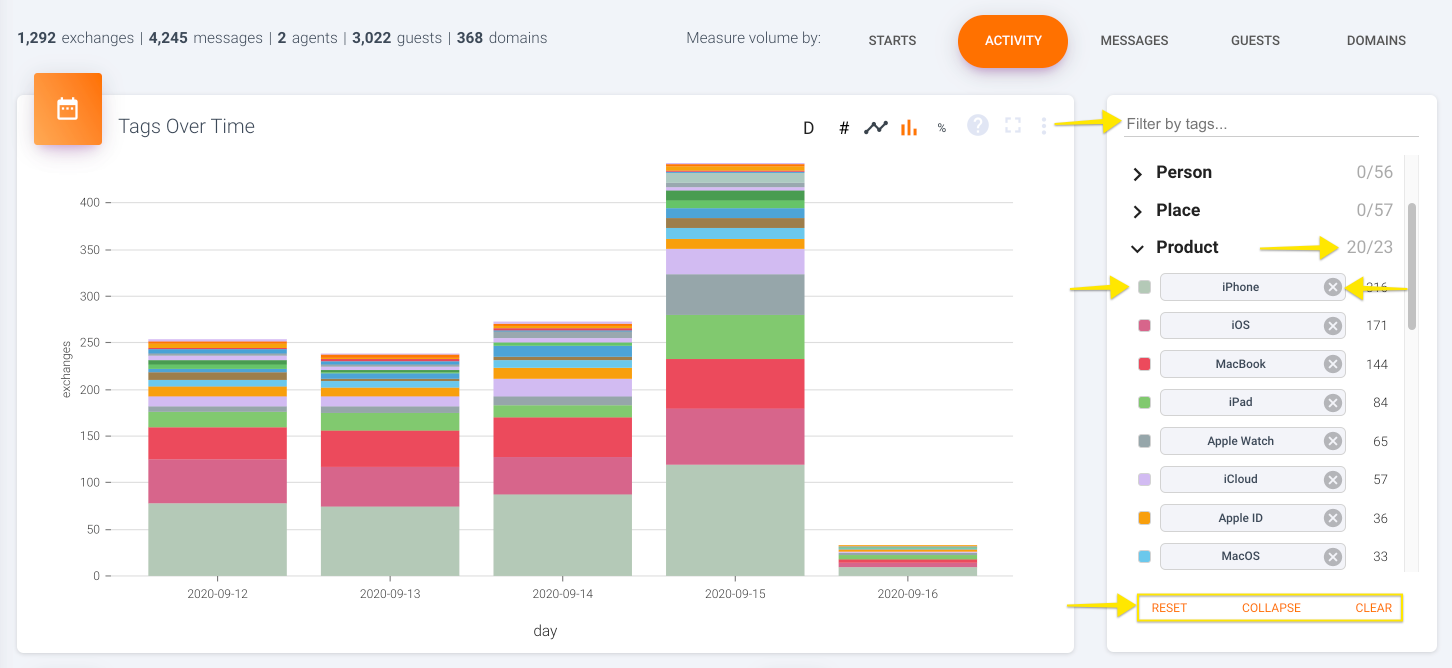
At the top right of the page is a legend, which you can use to define what is included and excluded from all the views on the page. By default it will load the tags applied to the most records in the current results, but you can also customize it by:
- Clicking the "x" on each tag the "clear" button at the bottom to remove tags
- Searching for and applying individual tags or tag groups in the legend search bar
- Adding (or removing) all tags in a group at once by clicking on the number currently shown (I.e. clicking the "0" in "0/10)
- Changing the color of a tag in the graphic by clicking on the color square by its name
What Volume am I measuring?
You can change the metric represented throughout the dashboard to be based on one of five types of values:
- Starts: The number of exchanges started
- Activity: The number of exchanges that had any messages sent
- Messages: The number of messages sent
- Guests: The number of unique customers
- Domains: The number of unique domains (pulled via email address by default)
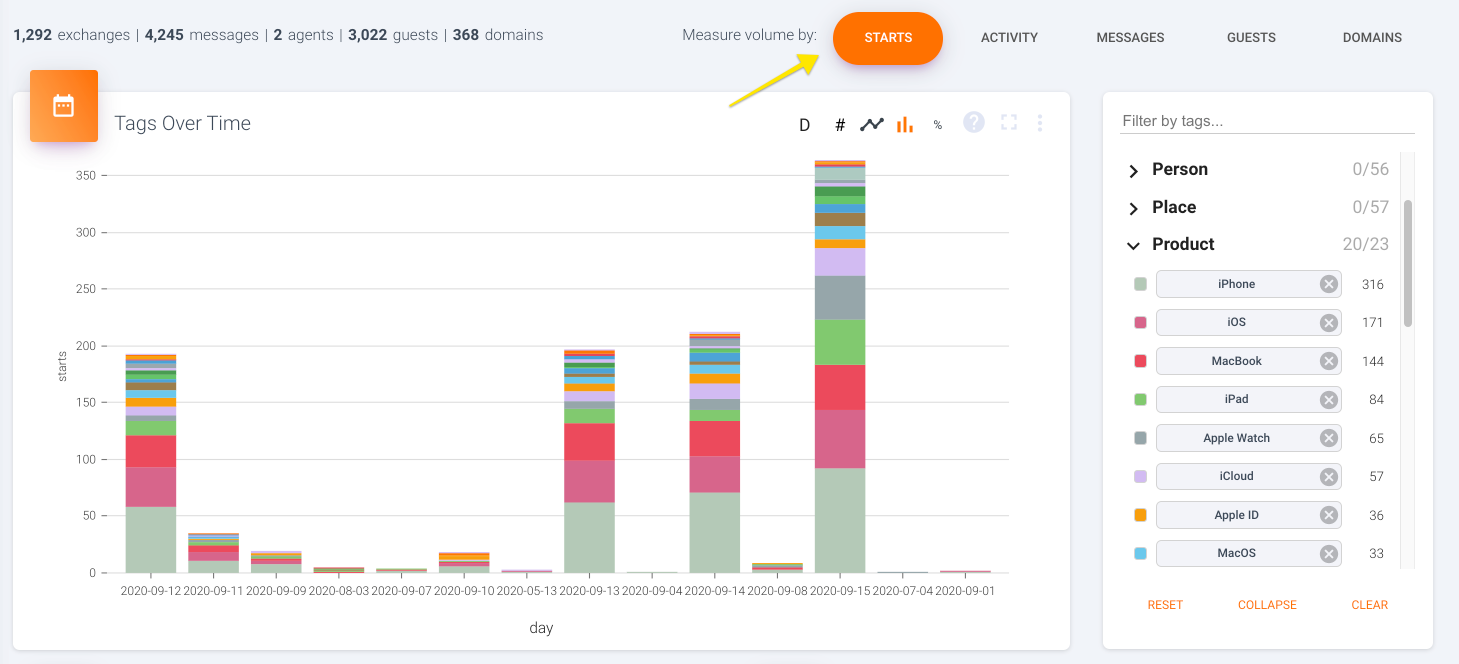
The number of exchanges started
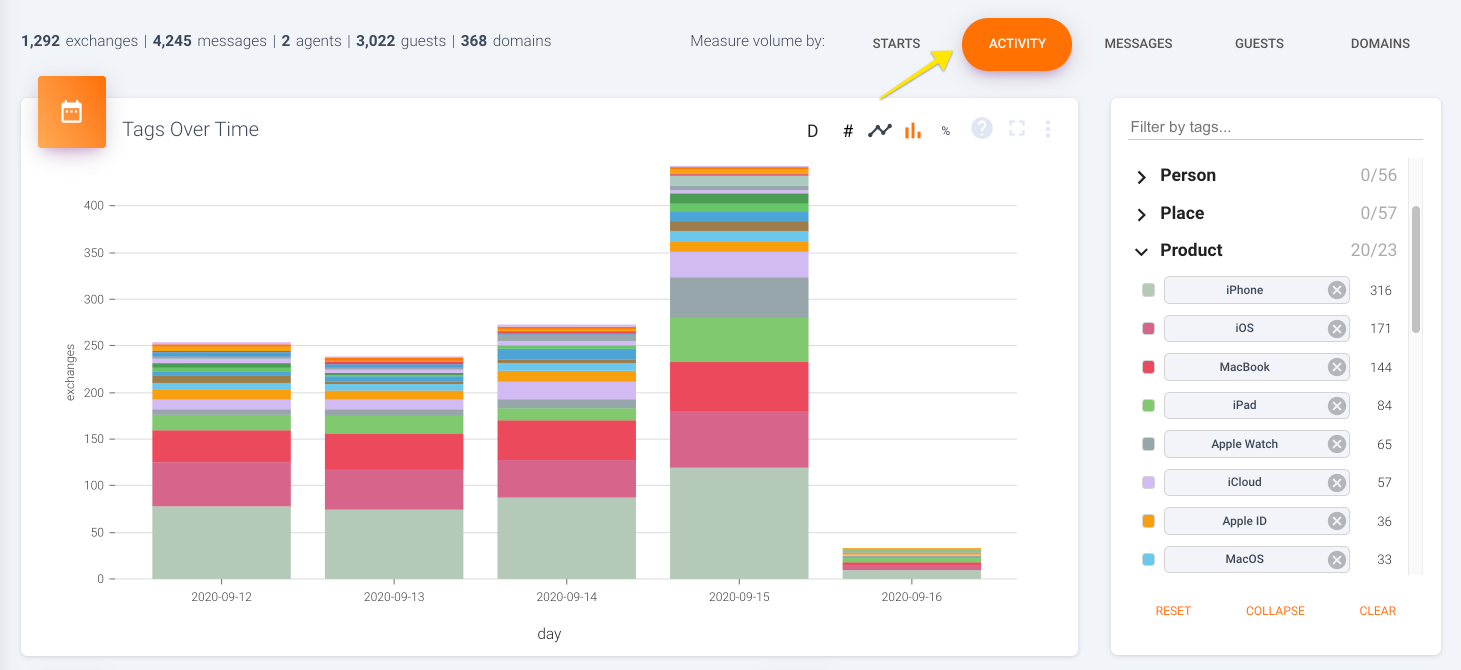
The number of exchanges that had any messages sent
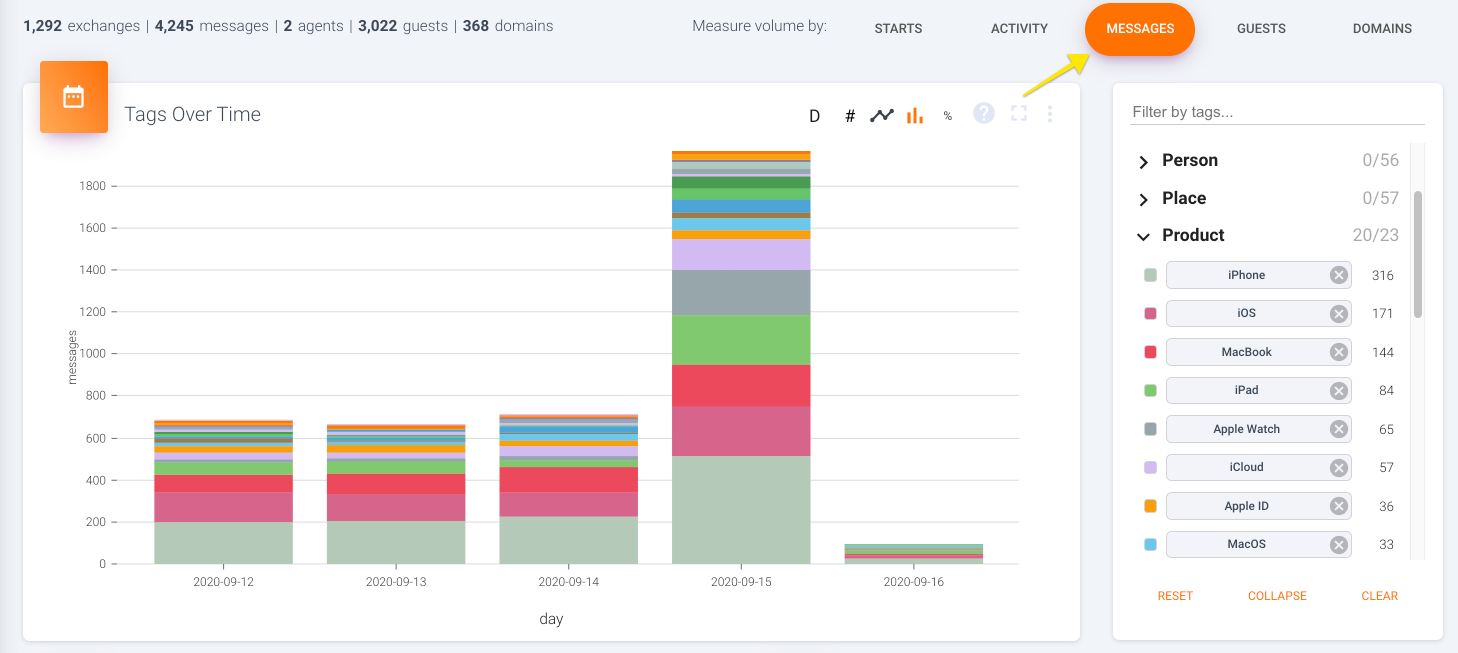
The number of messages sent
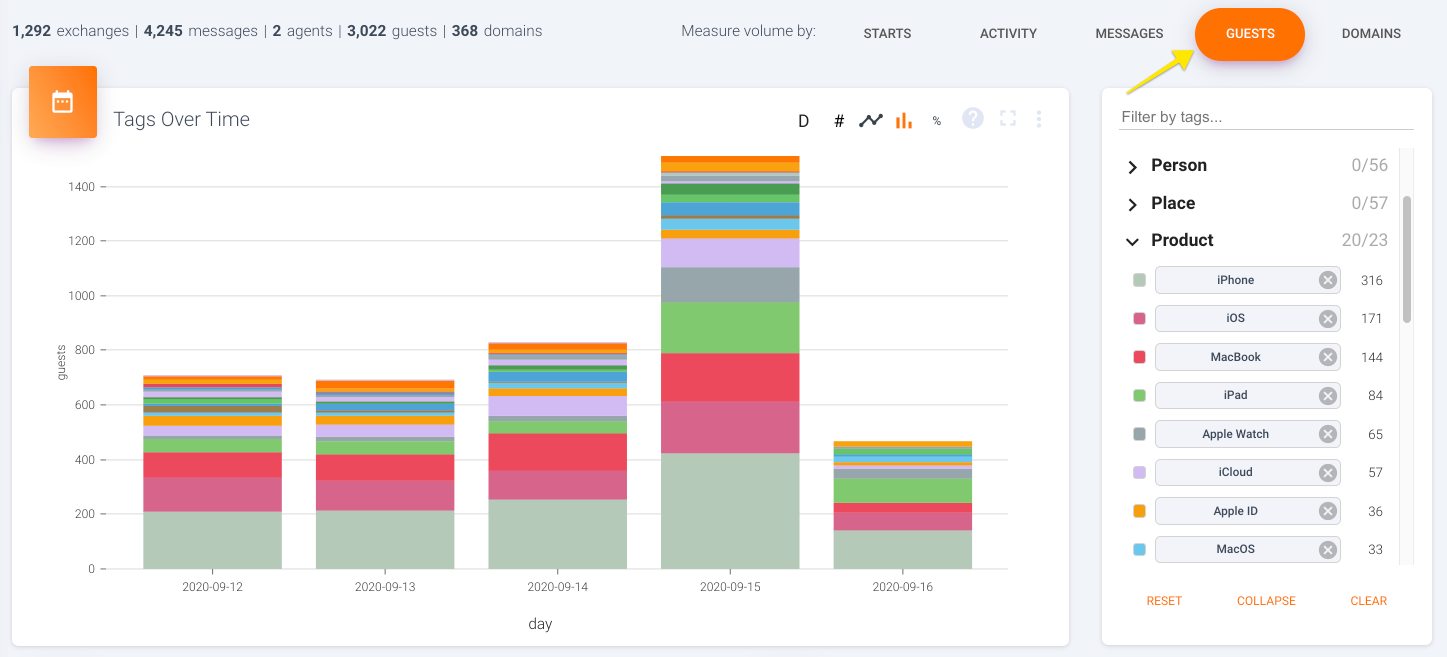
The number of unique customers
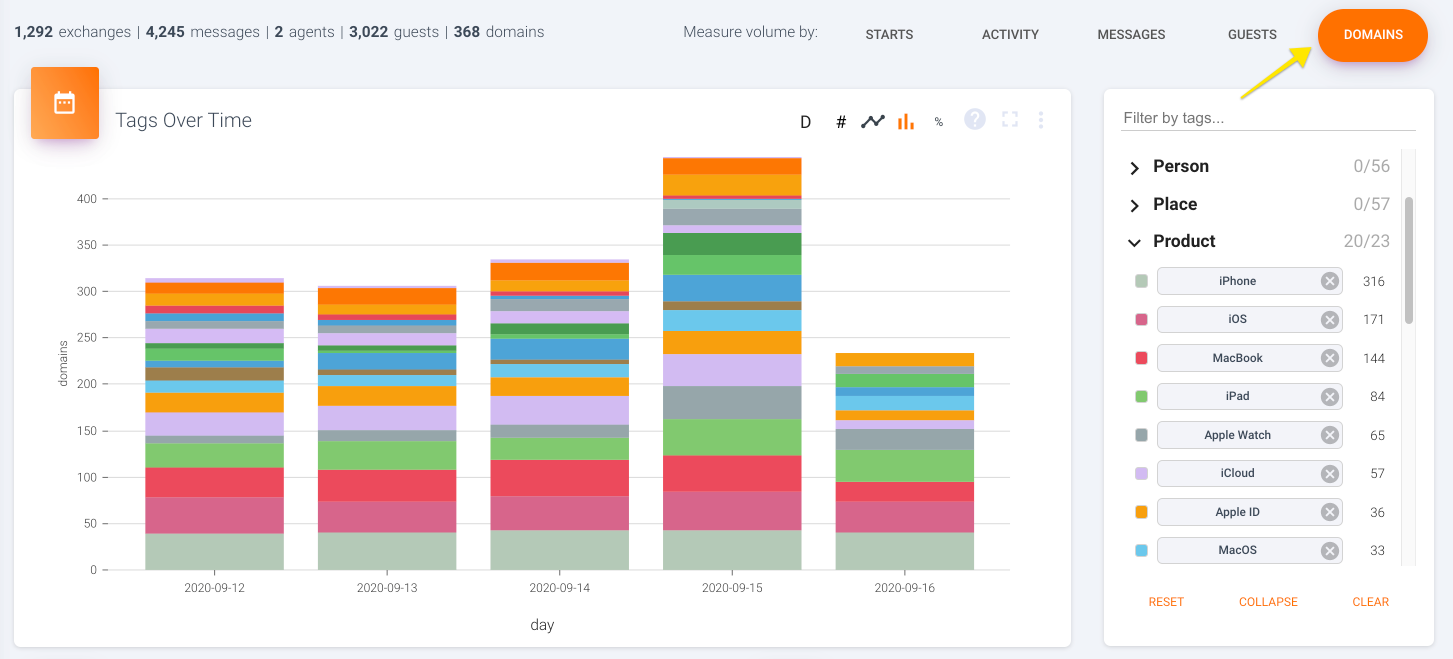
The number of unique domains (pulled via email address by default)
Updated over 1 year ago