Score Tiers and Flags
Score tiers can be configured for any or all of the scores in Scores Configuration. They allow users to bucket scores into tiers that are meaningful to them. Along with ranges, we can configure flags to direct attention to desirable or undesirable trends within any score range.

In the example above we have ranges and flags configured for the customer effort score as shown in the table below:
| Tier Name | Values | Color | Flag (optional) | Flag icon (optional) |
|---|---|---|---|---|
| Low | <10 minutes per record | green | - flag when greater than 30% of records fall in this range | - check |
| Medium | 10-50 minutes per record | yellow | - | - |
| HIgh | 50 to 90 minutes per record | red | - | - |
| Very High | more than 90 minutes per record | deep red | - flag when more than 10% of records fall in this range | - error icon |
- Flag icon options available
- star
- error
- bolt
- plus
- minus
- check
- circle
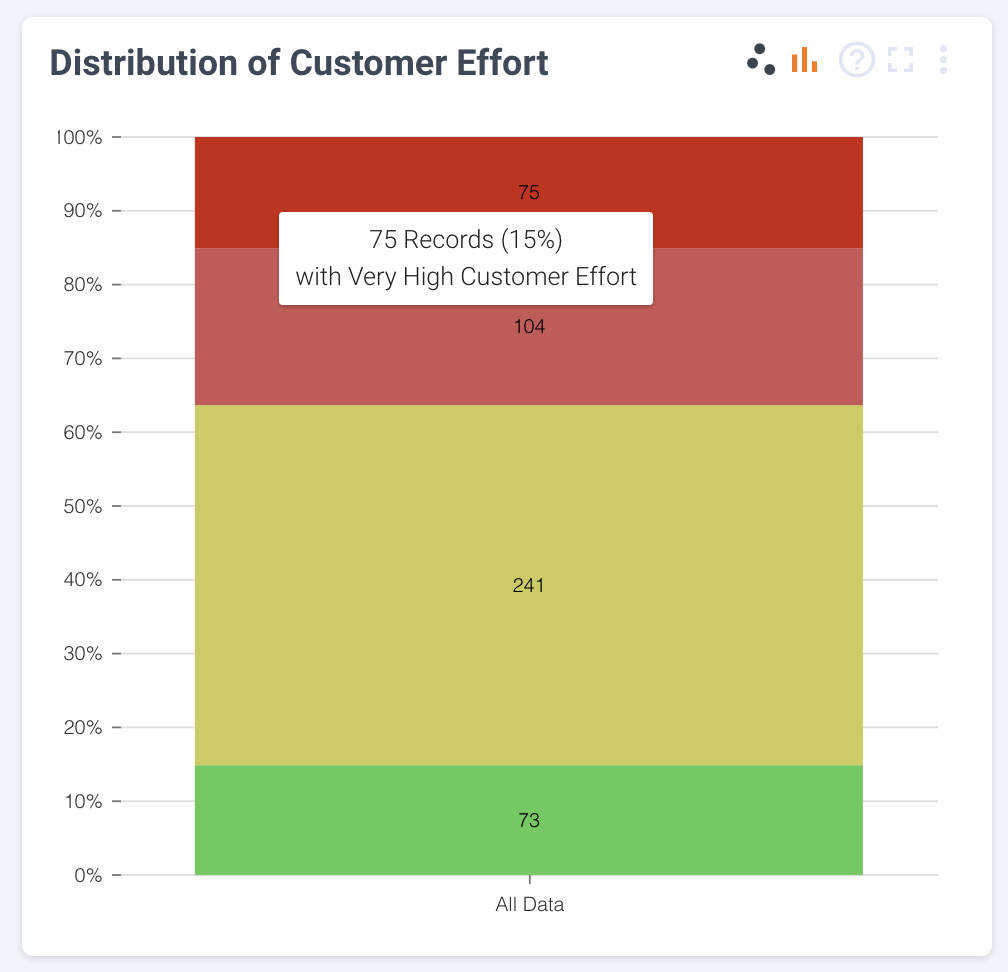
The Customer effort score shows us a flag with an error icon. The tooltip shows that 15% of the records are in the “Very High” range, higher than our 10% limit.

The scores table has a “Flags” column that you can sort the table by to view all the breakdown entities that exceed the limit.

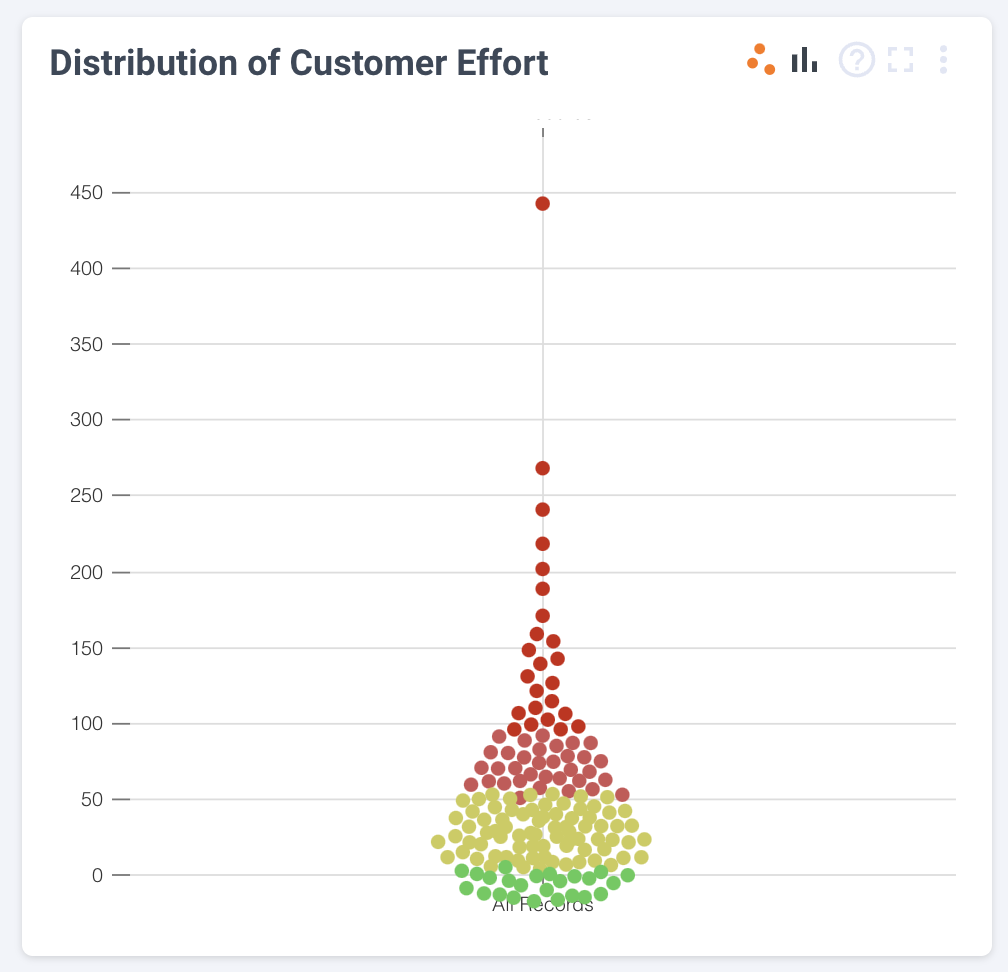
When ranges are defined for a score the distribution widget has an option to change the view from a swarm plot to a bar graph to view distribution across the score ranges.
Use Scores Configuration view to add Tiers and Flags
To add tiers and flags to your score, go to Configuration --> Scores Configuration
Updated over 2 years ago