Responsiveness
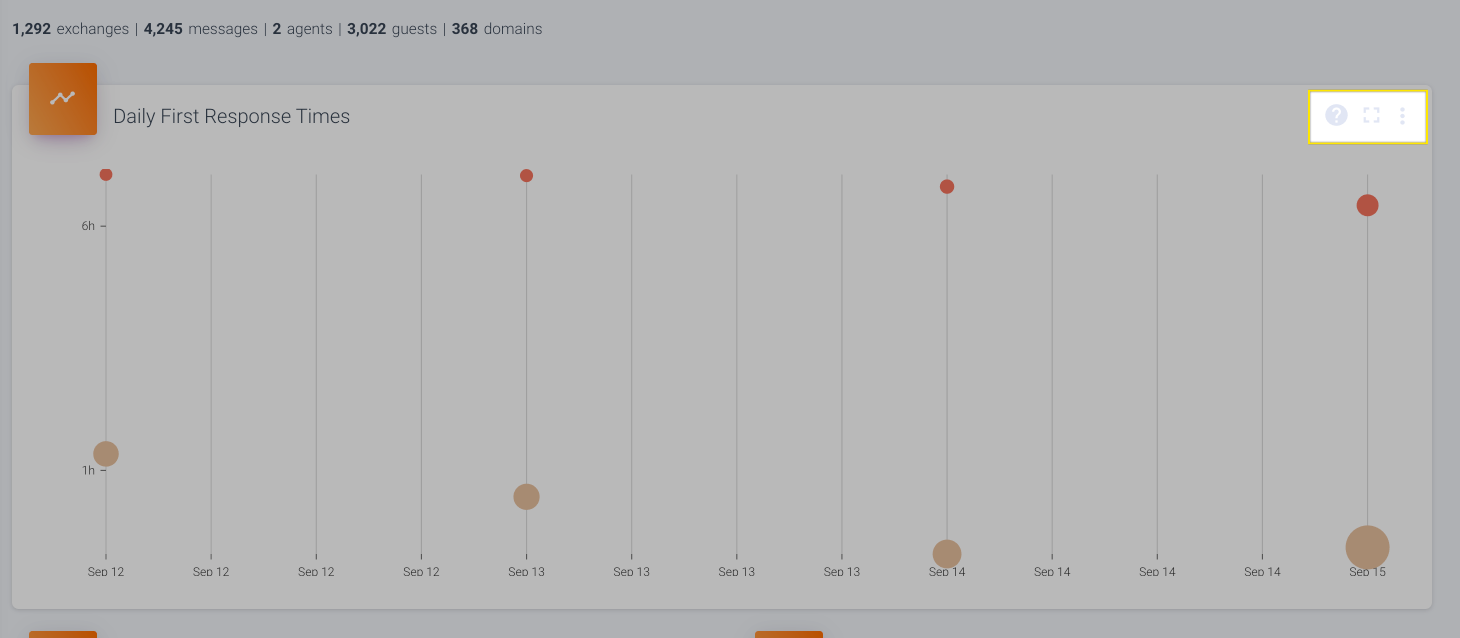
The Responsiveness dashboard includes a number of views to help understand the First Response Time ("FRT") for agents on records. Each view includes two metrics: the median FRT and the 95th percentile FRT, which reveals outliers that can be masked by averages.
Median vs. 95th Percentile
Percentiles, and 95th percentile in particular, are commonly used to monitor performance. Here's a Heroku article on alerting and a passionate blog post on response times that cover the topic in more detail.
View Options
Share the Screen
Any particular view can be bookmarked or shared with a teammate. Just copy the URL and send it over!
Every view on a dashboard includes at least three options in its top-right corner:
- Tooltip explaining what the view is
- Maximize the view
- Export the view's data (including data not shown) to a CSV

Updated over 1 year ago