Jump to Content
Frame AIFrame AI Home
Help CenterEnterprise API
Frame AI HomeLog InFrame AI
Help Center
Log In
Help CenterEnterprise API

Getting Started

  • Understanding Data Availability
    • Connecting Basic Sources
    • Connecting Zendesk
    • Connecting Salesforce
    • Connecting Help Scout
    • Connecting Slack
    • Connecting Gainsight NXT
    • Connecting Chorus
    • Pushing to productboard
  • Mastering the Search Bar
    • Search Filter Explanations
  • Saving and Sharing Views
  • Navigating Records
    • Contact Drilldowns
    • Tag Drilldowns
    • Widget Drilldowns
  • Optimizing Tag Setups
    • Auto-Tagging
    • Tag Management
    • Bulk Edit Tags
  • Leveraging Weekly Briefings
  • Okta SSO Integration Guide

Dashboards Overview

  • Browse
  • Scores
    • Score Cards
    • Breakdown and Distribution
    • Score Factors
    • Correlated Tags
    • Score Tiers and Flags
    • Time Period Selector
    • Scores Overtime
    • Signal-Based Scores Bound by a Range
  • Reports
    • Viewing Reports
    • Troubleshooting Reports
    • Configuring Reports
    • Insights

CONFIGURATION

  • Scores Dashboard
  • Scores
  • Breakdowns
Powered by 

Daily FRTs

Suggest Edits

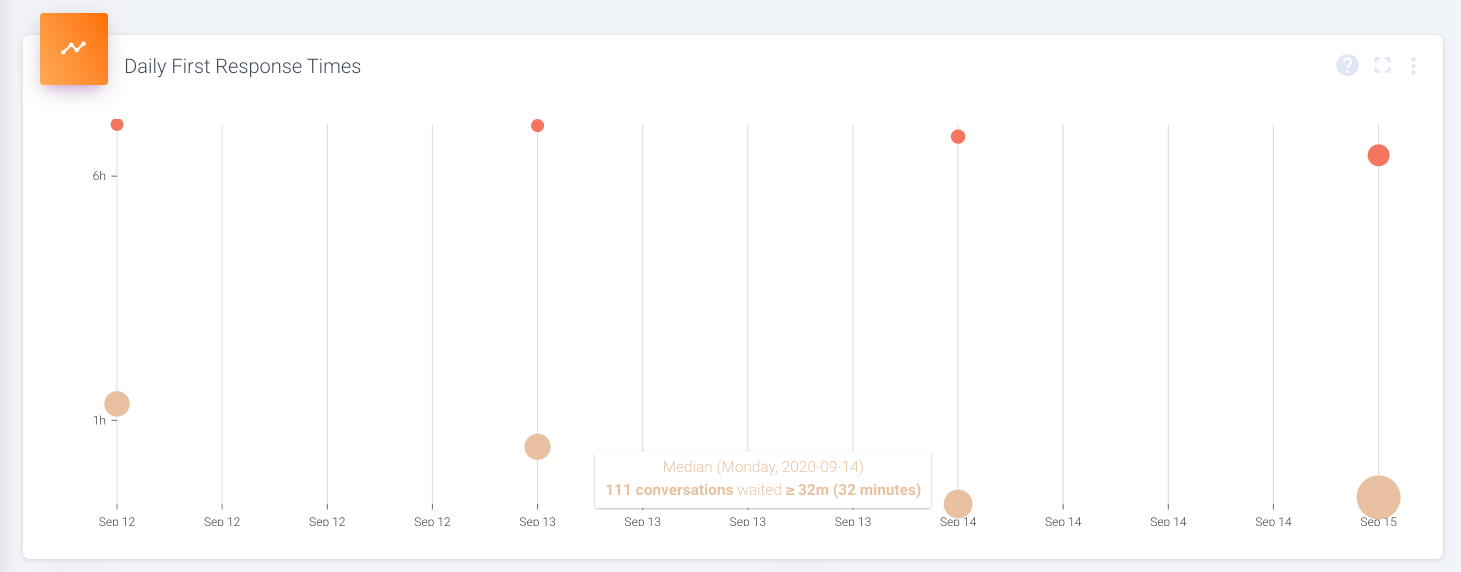
This view shows two dots for each day: the median and the 95th percentile FRT for the day. You can use it to understand whether there were any specific days where your response times differed from the norm.
1461

Hover over any dot to see the details that make it up

Updated over 1 year ago